GEOTECHNICAL ENGINEERING
HAMPTON VIRGINIA
HomeLaboratoryGrain size analysis (sieve + hydrometer)

Grain Size Analysis Sieve & Hydrometer in Hampton VA

Rigorous testing. Clear reporting.

LEARN MORE

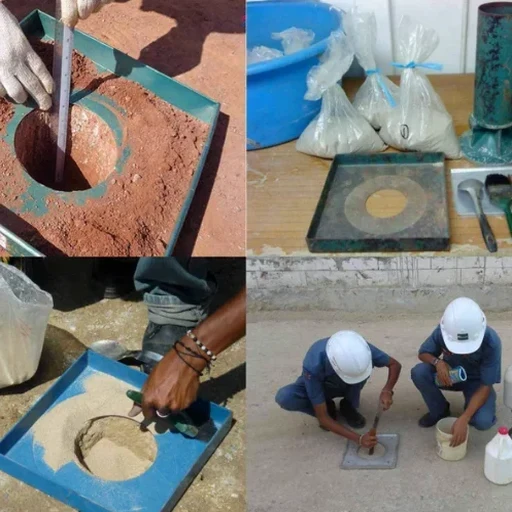
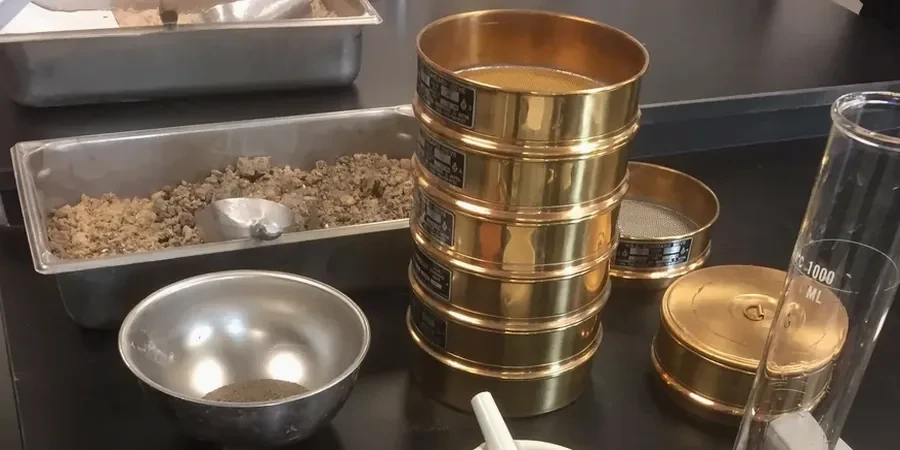
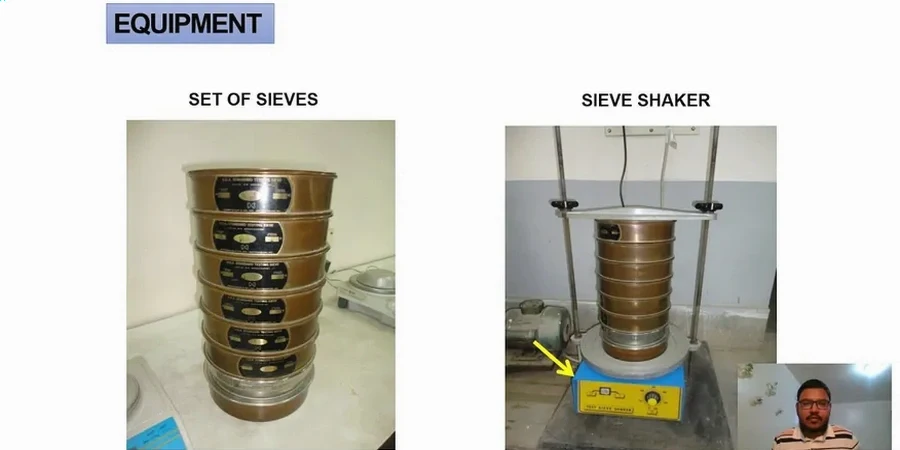
Hampton sits barely 10 feet above sea level on the Atlantic Coastal Plain, where the subsurface alternates between clean beach sands and deep, compressible silts deposited by the James River estuary. When a contractor hits gray muck at 6 feet on a Kecoughtan Road site or a residential lot in Fox Hill, the first question the geotechnical engineer asks is whether the fines are silt or clay—and that distinction comes straight from a combined sieve and hydrometer analysis. Our lab runs ASTM D422 and D6913 procedures daily on Hampton soils, pairing mechanical shaking with the hydrometer sedimentation method to build a complete particle-size distribution curve from gravel down to the colloidal fraction. For sites near the Hampton Roads Harbor Tunnel or along the Back River shoreline, we often complement the grain size curve with an atterberg limits determination on the minus-40 fraction, because plasticity tells the story that gradation alone cannot.

In Hampton, the difference between a well-graded sand and a gap-graded silty sand determines whether your footing drains or holds water against the slab.

Our service areas

Our approach and scope

After processing hundreds of Hampton samples, our team has learned that the biggest practical problem here is not the testing itself—it is the sample preparation. Many of the local Yorktown Formation silts and the overlying alluvial clays contain iron-cemented concretions and shell fragments that will skew a sieve analysis if the technician just dumps the bag into the stack. We wash every sample through the No. 200 sieve before oven-drying, then dry-sieve the coarse fraction and run a full hydrometer on the fines using sodium hexametaphosphate as the dispersant. The result is a clean curve that lets the design engineer classify the material per ASTM D2487 (USCS) without guessing whether a borderline ML-CL material is really a lean clay or a silt with some cohesion. For projects that also need to know the in-place density, our field crew can run a sand cone density test on the same lift to verify compaction against the lab-derived maximum dry density.
Grain Size Analysis Sieve & Hydrometer in Hampton VA
Technical reference — Hampton Virginia

Site-specific factors

The hydrometer side of a grain size analysis is where inexperience shows fastest. We use a 152H hydrometer calibrated at 20°C, and every reading gets corrected for the actual suspension temperature, the meniscus rise, and the dispersant blank determined from a companion cylinder. Skip the blank correction on a Hampton silty clay with 40 percent fines, and you will overestimate the clay fraction by 3 to 5 percentage points—enough to misclassify a CL as a CH and trigger a completely different bearing capacity assumption. Our technicians run duplicate hydrometer readings at 2, 5, 15, 30, 60, 250, and 1440 minutes, plotting the curve against a standard logarithmic template. We also check the percent passing the No. 200 from the wash against the hydrometer total to catch any mass-loss errors before the report leaves the lab.

Need a geotechnical assessment?

Reply within 24h.

Email: [email protected]

Watch the video

Regulatory framework

ASTM D422 – Particle-size analysis of soils (hydrometer method), ASTM D6913 – Particle-size distribution (sieve analysis), ASTM D2487 – Unified Soil Classification System (USCS), ASTM D1140 – Amount of material finer than No. 200 sieve, AASHTO T 88 – Particle size analysis of soils, IBC 2024 – Referenced standard for foundation design soil classification

Reference parameters

ParameterTypical value
Sieve size range (coarse fraction)3 in to No. 200 (ASTM D6913)
Hydrometer range (fines)0.075 mm to ~0.001 mm (ASTM D422)
Dispersant usedSodium hexametaphosphate (NaPO₃)₆
Minimum sample mass500 g for sandy soils; 200 g for fine-grained
Classification standardASTM D2487 (USCS) or AASHTO M 145
Coefficients reportedD10, D30, D60, Cu (uniformity), Cc (curvature)
Hydrometer correction factorsTemperature, meniscus, dispersant blank

Common questions

What does a combined sieve and hydrometer analysis cost in Hampton?

A full ASTM D6913 sieve plus ASTM D422 hydrometer analysis on a single sample runs between US$100 and US$210, depending on whether we also run Atterberg limits on the fines fraction. The price includes the complete gradation table, the plotted curve, and the USCS classification with group symbol and group name.

How long does the hydrometer portion take to complete?

The hydrometer sedimentation test requires a minimum of 24 hours of undisturbed settling to capture the full range of particle sizes down to the clay fraction. We take readings at standard intervals through the first day and a final reading the following morning. The combined sieve and hydrometer report is typically ready within 48 to 72 hours after the sample arrives at the lab.

Can you classify Hampton soils that contain shell fragments or organics?

Yes. We screen for visible shell and organic material during sample prep. If the soil contains enough organics to affect behavior, we note it on the report and can run an organic content test (ASTM D2974) by loss-on-ignition. For shell-rich sands common along the Hampton waterfront, we break down fragile shell pieces before sieving to avoid artificially shifting the coarse fraction.

What D-values do you report and why do they matter?

We report D10, D30, D60, the coefficient of uniformity (Cu), and the coefficient of curvature (Cc) for every sample. Those numbers are essential for filter design, drainage blanket specification, and assessing the liquefaction susceptibility of sandy soils—a real concern in Hampton given the shallow water table and seismic activity from the Central Virginia Seismic Zone.

Location and service area

We serve projects in Hampton Virginia and surrounding areas.

View larger map